Billing Dashboard |
  
|
Billing Dashboard |
|
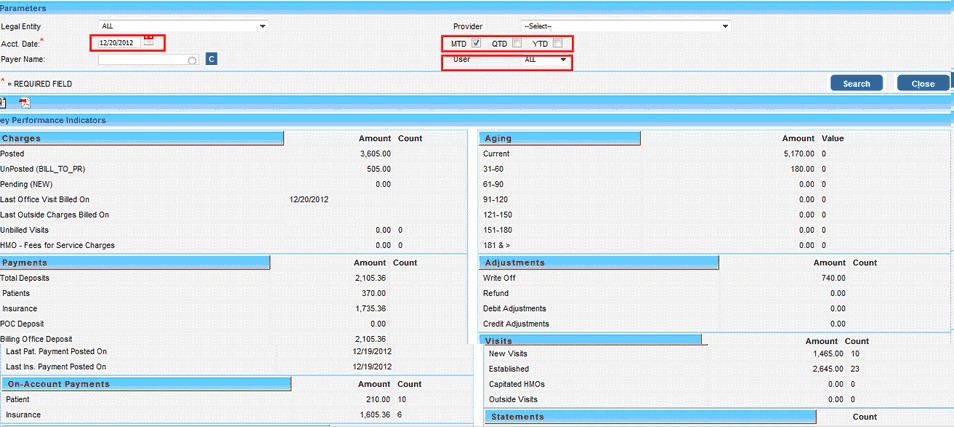
The Billing Dashboard report provides an overview of the various activities. It provides Supervisors/Managers a single place to view the financial and other critical activities of a database. Managers can get a snapshot of the key performance indicators to analyze the revenue factors and cash flow blockers for the entire database or run the report by user to look up key activities performed by the user.
The report is available in the Report Central under the Dashboard section. The report can be run with a Month to Date/ Quarter to Date/ Year to Date filter.
Some of the Key Performance indicators that can be viewed on the Report are –
1.Charges
Posted/Unposted/Pending charges.
2.Payments/ On Account
Total Deposits/ Patient & Ins. split/ Last payment posted date/Unapplied.
3.Collections & Aging
Claims resubmitted for prior months/ Outstandings by Aging buckets
4.Visits
Total Visits and Amounts
5.Patient Statements
Count of Statements generated.
6.Cash Flow Blockers
Office and Outside charges resubmitted over 15 & 30 days respectively.